Facebook is by far the most popular social media platform, with over 1.8 million active users it is a vital part of many businesses’ marketing plan and strategy. You may have the page created with posts regularly being published, but do you know how to effectively use the insights section? Some of you may not even know what that is, because of this we have collated EVERYTHING you need to know about the ‘Overview’ section in one area.
Welcome to Facebook insights- Overview section.
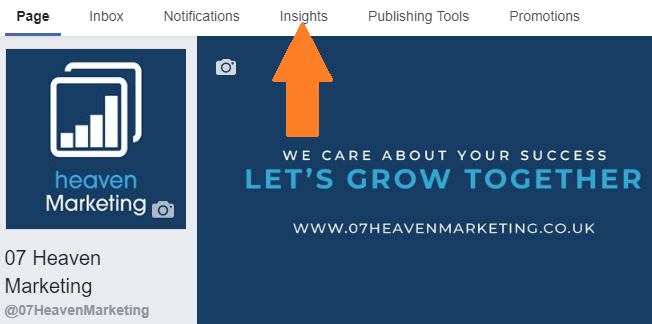
When you go onto your business’ Facebook page, there is a navigation bar at the top. One of the sections will be called ‘Insights’- this is where all of your analytical needs dreams become reality.
This will automatically open your ‘overview’ page, giving you a page summary with all of the most important information. Here you can change the time range from today, yesterday, the last 7 days and the last 28 days, depending on the time frame you would like to see.
FYI: you can export this data into a handy excel spreadsheet in order to keep track of your analytics, essential in the analysis stage.
Another factor to look out for is the key, this explains which colour represents whether the analytics are organic (natural analytics, colour blue) or paid (promoted content analytics, colour green).
On this page you will see:
Actions on page – The number of clicks on your Page’s contact information and the call-to-action button.
Page views – The number of times your Page’s profile has been viewed by logged-in and logged-out users.
Page previews – The number of times users have hovered over your Page name or profile picture to see your preview.
Page Likes – The number of new users who have liked your Page.
Reach – The number of users who had any of your posts on their screen.
Recommendations – The number of times that users recommended your Page.
Post engagement – The number of times that users engaged with your post, e.g. likes, comments, shares and more.
Videos – The total number of times that your videos have been viewed for more than three seconds. Anything less than 3 seconds is not counted as a user has not actually watched the video, perhaps only scrolled past.
Page followers – The number of new users who have followed your Page during the chosen timeframe.
You will then see your ‘5 Recent Posts’, this gives specific analytics on your last 5 posts.
Published – The date and time in which the post was shared.
Post – Image and a small snippet of the post’s text.
Type – The type of post shared, e.g. link, image, video, status.
Targeting – Whether the post was public or private/ who you shared the content with.
Reach – If your post reaches someone’s timeline/ the number of users who had your post on their screen.
Engagement – The number of times that users engaged with your post, this is split into the number of post clicks and the number of reactions e.g. likes, comments & shares.
Promote – This gives you the option to boost your post for a fee. This feature allows your post to appear on users’ timelines who do not necessarily follow you, it will appear as a ‘sponsored post’. This is often placed on users’ timelines who share similar interests, are a similar demographic or like similar pages. The amount of money spent will depend on how many users the post is shared with.
After that, you will see ‘Pages to watch’. This area tells you pages which are posting similar content to you, therefore are competitors. This information is vital as it could show who is selling to similar audiences, provide ideas on new content and average analytics for that particular page. You can choose pages to watch, but Facebook also recommends pages that it deems similar. You can add your own page to clearly compare your page to others.
Page – The pages which you have entered to watch will appear in order of how successful their page is. Their page will be ranked, named and have their profile picture.
Total page likes – The total number of likes on their page to date.
From last week – A positive or negative percentage on whether their total number of page likes has increased or decreased.
Posts this week – The number of posts they have published this week.
Engagement this week – The amount of engagement they have received this week, e.g. likes, comments & shares.
Keep a lookout for future easy to understand explanations of the Facebook Insights page, it could make the difference for your social media presence. You understand the importance of social media and how it affects your business, therefore do not neglect the possibilities of the free analytics provided.
For further insights and guidance, we invite you to explore our blog at 07hm.co.uk/blog. Here, you’ll find a wealth of information tailored to the needs and challenges of SMEs navigating the digital landscape. Additionally, if you have specific questions or need personalised advice, don’t hesitate to reach out to us via email at info@07hm.co.uk or telephone on 01702 410663.